

The customer
Fluxys is Belgium’s independent operator of the high-pressure natural gas transmission network, the natural gas storage infrastructure in Loenhout and the liquefied natural gas (LNG) terminal in Zeebrugge. Fluxys combines expertise with close customer interaction to provide high-level services for their supplies into Belgium and the markets beyond. As a Fluxys group company it is their mission to contribute to a sustainable energy future and to secure reliable and affordable energy flows into the market.
Fluxys Belgium is a Euronext listed subsidiary of energy infrastructure group Fluxys headquarted in Belgium. With 900 employees the company operates 4,000 kilometers of pipeline, a liquefied natural gas terminal totaling a yearly regasification capacity of 9 billion cubic meters and an underground storage facility.
As a purpose-led company, Fluxys Belgium together with its stakeholders contributes to a better society by shaping a bright energy future. Building on the unique assets of its infrastructure and its commercial and technical expertise, Fluxys Belgium is committed to transporting hydrogen, biomethane or any other carbon-neutral energy carrier as well as CO2, accommodating the capture, usage and storage of the latter.
The context
Fluxys is working constantly to guarantee pipeline integrity in order to prevent potential hazards, so that it contributes to the safety performance of the European gas transmission network to the general public and authorities.
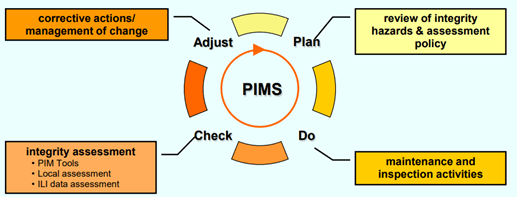
Fluxys applies a Pipeline Integrity Management System process. The emphasis of PIMS lies on prevention, detection of potential hazards and subsequent remedial measures that need to be taken.
PIMS process follows the basic principle plan – do – check – adjust:
The data science project
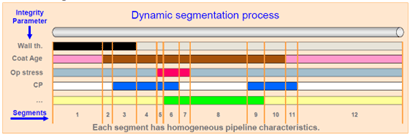
The likelihood and consequence of a hazard are calculated for each pipeline segment. A pipeline segment refers to a part of a pipeline that has constant consequence and likelihood scores along its length. The segmentation is different for each hazard type. The Database contains 350.000 pipeline segments over 674 pipelines.
Most influencing parameters (also hazard types) according to EGIG are:
- External Corrosion
- Internal Corrosion
- Mechanical Damages
- Construction Defects
- Manufacturing Defects
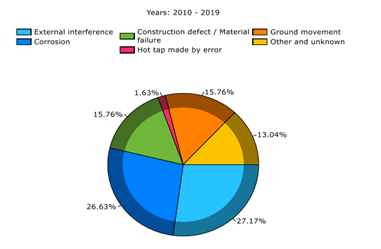
EGIG is a co-operation between a group of eighteen major gas transmission system operators in Europe to gather data on the unintentional releases of gas in their pipeline transmission systems. It is also the owner of an extensive gas pipeline-incident database. The creation of this extensive pipeline-incident database (1982) has helped pipeline operators to demonstrate the safety performances of Europe’s gas pipelines. The incident distribution per cause over the last 10 years is as follows:
Likelihood of a threat:
After the pipeline has been segmented and each parameter scored, the likelihood of a threat per segment is calculated.
A discretization of the likelihood scores is applied for each of the 5 hazard types into classes “E”, “H”, “M” and “L”.
Consequence of a threat:
The consequence is a measure of the impact of a potential threat on human life, the environment, urban infrastructure, rural area, etc. The impact on human life has the most significant weight.
The affected area considered due to a leak/rupture will take into account the following criteria:
- Life safety criteria
- Environmental criteria
Consequences of a leak/rupture are independent of the type of hazard. The consequence score of a segment can be characterized by a single number. The so called z-score gives how many standard deviations the consequence score for a specific hazard and segment is distant from the overall average.
We have calculated:
- A consequence score Zx for each segment i
- A combined consequence score
The likelihood for a segment is transformed in KLIK values that count the occurrences of “E”, “H” and “M” hazard types. The consequence scores have been discretized.
Based on the results on individual segments an approach has been worked out to rank pipelines. This ranking system was based on:
- The relative length of the segment
- The height of the scoring achieved per hazard of the segment. Extreme scores have higher impact than High and so on
- The number of segments with high scores within the pipeline
- The consequences in case of leak or rupture
We have used the formulas as indicated and proposed by Prof. J. Van Dyck (KUL – University of Leuven) based on previous research.
We have used following technology:
- Power BI
- Azure cloud
- Python
ABOUT THE AUTHOR

Alain Goossens
Managing Partner Wallonia